Coronavirus statistics API – implement COVID-19 statistics data to any system.
According to statistics WHO, the impact of businesses without data has led to increased morbidity and second waves in many countries worldwide.
We interviewed our partners and found out that employers are not in a hurry to react. This just means that many business owners are based only on their opinion without studying any data.
This day, the most reliable source is statistics collected by Johns Hopkins University.
Johns Hopkins University is one of the oldest research universities in the Western hemisphere, known for its strong training in medicine, chemistry, biology, and law. The University’s 36 Nobel Prize laureates are scientists. During the pandemic, Johns Hopkins University conducts a number of studies on coronavirus and serological tests, as well as publishes daily detailed statistics on diseases worldwide and in the United States.

In mid-March 2020, Johns Hopkins University launched a major program in search of possible actions and funds against coronavirus and redirected $6 million of funding there. Johns Hopkins University’s resources have enabled it to become one of the main sources of information on coronavirus distribution. The site offers an interactive map COVID-19 with the most detailed and relevant statistics on the world and the United States, published analytical materials on the topic.
But the data without analysis and reaction – is just a nothing means numbers. So the next step after collecting data and its analysis – using it to decrease the coronavirus death rate.
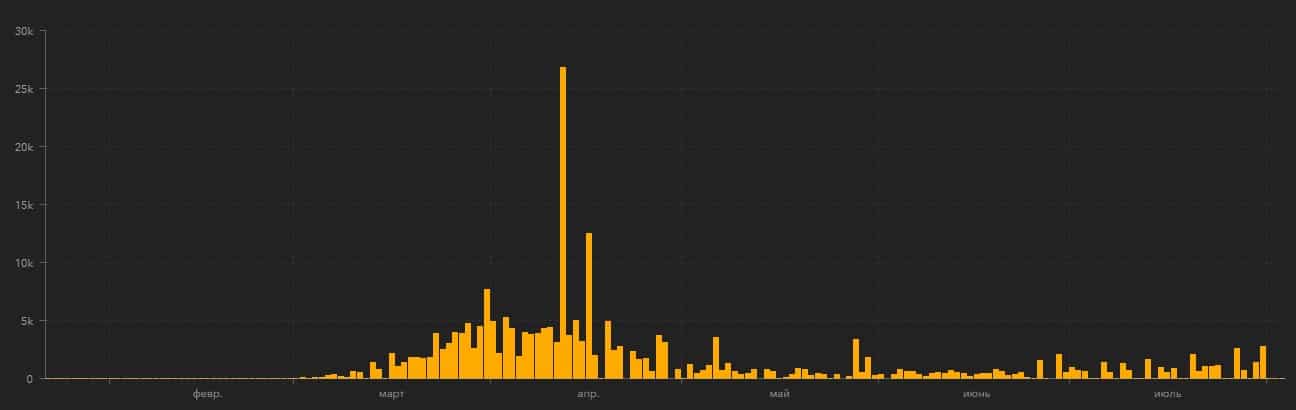
From Statistics on the official John Hopkins portal, we see that Europe is experiencing a resurgence in cases. The reason for it could be that people are extremely relaxed about social distancing during the summer months.
Spain has become again a European hotspot with increasing infection rates in its northeastern regions near Barcelona, which prompted the government to issue more restrictions.
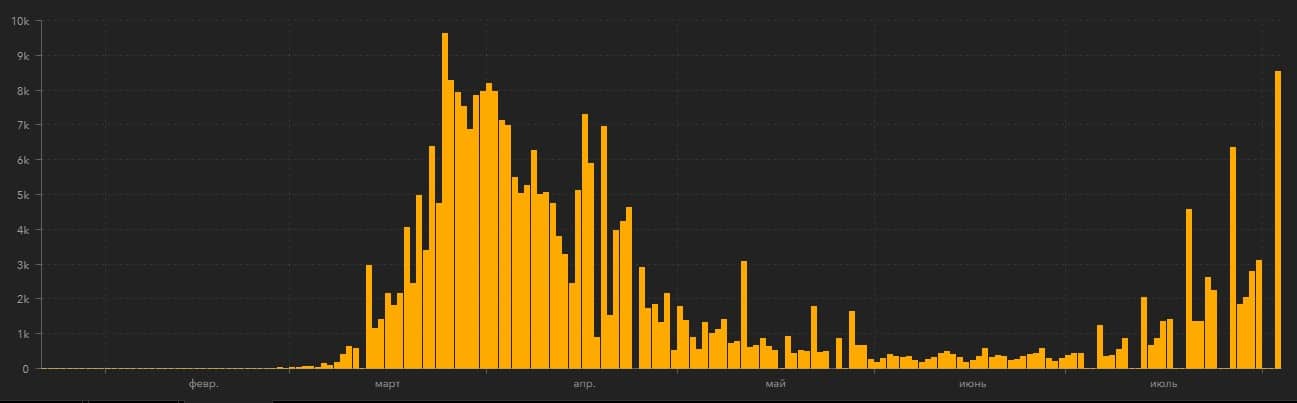
France has seen a 78 percent increase in its weekly COVID-19 incidence rate per 100,000 people. New cases have increased from a couple of hundred per day to more than 1,000. Sure, some of it is due to expanded testing and locating of asymptomatic cases( in young adults). Health officials have warned that more young people are testing positive for the virus as they ignore social distancing.
Due to the current situation, business owners should be more aware of statistics and use all possible ways of using this data in daily routine. In this case, you can understand whether to return to the office or leave employees at home for an extra week because it is better to have an extra week of remote work than total employees on sick leave. As they said “forewarned is forearmed”.
We have made an in-house corporate chatbot for our employees that informs all of them in the morning about the situation with coronavirus update in Ukraine and neighboring countries so they could understand the situation from the first hand. Our bot also recommends them if the case count was extremely growth yesterday and they should stay at home even if they have no restriction to go out. Also for us, as for business owners, it’s a good instrument that helps to analyze is it a good time to gather everyone in the office or our team still should work remotely.
John Hopkins university only gives coronavirus statistics data on the site. It’s inconvenient to track all the information by checking the pages and there was no chance to implement actual COVID-19 statistics into the other systems. So the guys from our web department(Axisbits) have developed an absolutely free COVID-19 Statistics API to implement connections to this data in any system.
This API could help you to get the coronavirus statistics about:
On GitHub: COVID-19 Statistics API

– coronavirus world countries( regions, province, city, date);
– coronavirus confirmed cases;
– coronavirus death rate;
– coronavirus recovery rate;
– activate diff;
– last update.
Our coronavirus statistics API is already used by news portals in America, such as:
https://www.vaildaily.com/coronavirus/
https://www.steamboatpilot.com/
https://www.postindependent.com/coronavirus/
It’s a great honor for us to help people fight COVID-19 even in such a way.
TAGsoft decided not to take people out of the office for the duration of the quarantine. The statistics in our country remains very high despite the relaxation. We value the lives of our employees and call on you to take responsibility for all quarantine activities and keep track of statistics.
Last Posts:

Typical software development teams’ structure and Agile engineering are often considered better than the old modes of software development because…

Could you spare me a couple of minutes? I have a really interesting idea!Okay, you have 1 minute. So, what…

We all have heard and continue witnessing extremely successful projects, “unicorns”. However, by studying startups which failed we can discover…

Previously, we have covered financials a startup should have and we mentioned a business plan several times. In the 12th…